# Visual Integrals for Programmers
## Plain English first
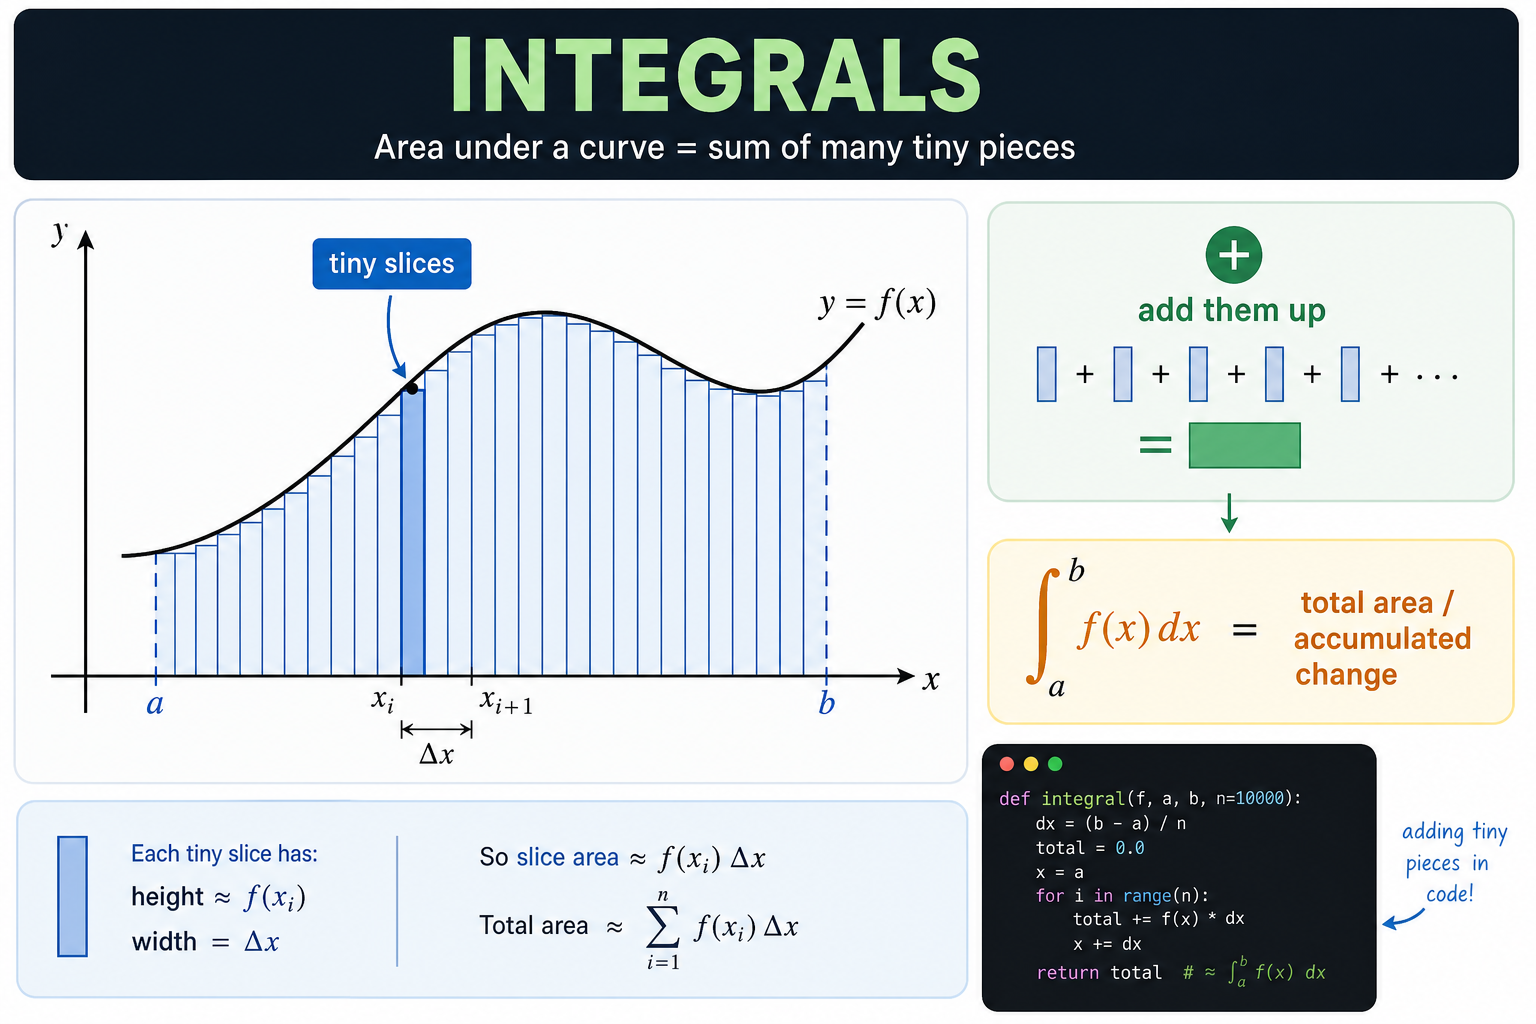
An integral adds up a huge number of tiny pieces.
Picture a hilly field. You want to know the total area. You can't measure it in one go — so you slice it into thousands of thin vertical strips, measure each strip's area (height × width), and add them all up.
The integral is what you get when the strips become infinitely thin.
## The picture
```text
f(x)
| ***
| ** **
| * *
| * *
| * *
|* *
|________________ x
a b
Sum of all the thin rectangles underneath the curve
from x = a to x = b
```
## Standard math notation
```text
∫[a to b] f(x) dx
Read as: "the integral of f(x) from a to b"
dx means "a tiny slice of width dx"
```
## Verbose Python with descriptive names
```python
def compute_area_under_curve(
function_to_integrate,
left_boundary,
right_boundary,
number_of_rectangles
):
"""
Estimate the area under a curve between two x values.
Splits the interval into many thin rectangles.
Each rectangle has:
- width = total_width / number_of_rectangles
- height = function value at the left edge of that rectangle
Adding all rectangle areas gives the approximate integral.
More rectangles → more accurate answer.
"""
total_width_of_interval = right_boundary - left_boundary
# Width of each individual rectangle slice
width_of_each_slice = total_width_of_interval / number_of_rectangles
accumulated_area = 0
for rectangle_index in range(number_of_rectangles):
# x position at the left edge of this rectangle
x_position = left_boundary + rectangle_index * width_of_each_slice
# Height of the rectangle equals the function value at this x
height_of_rectangle = function_to_integrate(x_position)
# Area of this one rectangle
area_of_this_rectangle = height_of_rectangle * width_of_each_slice
accumulated_area += area_of_this_rectangle
return accumulated_area
# Example: area under f(x) = x² from 0 to 3
# True answer: [x³/3] from 0 to 3 = 27/3 = 9
def square_function(x):
return x * x
estimated_area = compute_area_under_curve(
function_to_integrate=square_function,
left_boundary=0,
right_boundary=3,
number_of_rectangles=10_000
)
print(estimated_area) # very close to 9.0
```
## What integrals measure in the real world
The key insight: integrals measure **accumulation over time or space**.
| Situation | Function f(x) | Integral gives you |
|-----------|---------------|-------------------|
| A car accelerating | speed at time t | total distance traveled |
| Water filling a tank | flow rate at time t | total volume added |
| Revenue over time | dollars per day | total revenue |
| Signal strength | power at frequency f | total energy |
## Common mistakes
- Thinking more precision always matters. For most applications, 1000 rectangles is already very accurate.
- Forgetting that the function can be negative — areas below the x-axis subtract from the total.
- Confusing "area under the curve" with the shape's visual area — if f(x) dips below zero, the integral can be less than the visual area.
## See also
- [Visual Calculus for Programmers](/articles/cbda355b-86cb-4c12-aebb-de239c2eb6b4)
- [Visual Limits for Programmers](/articles/78ce0fe1-1e06-4fd6-98a1-b539a8b5c99f)
- [Visual Optimization for Programmers](/articles/2752f4e0-dc22-4252-81fe-66acea5fefc3)
- [Visual Calculus — Table of Contents](/articles/fea3e669-0917-44f9-abee-4a012a962f96)